Edit chart
Loading graph
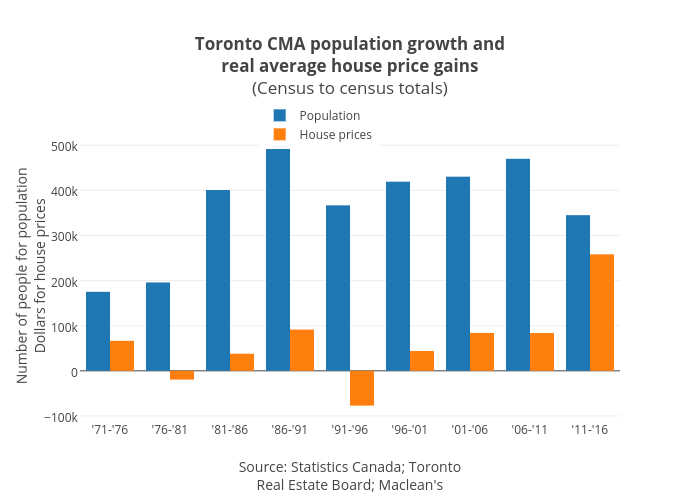
Jasonkirby's interactive graph and data of "Toronto CMA population growth andreal average house price gains(Census to census totals)" is a bar chart, showing Population vs House prices; with Source: Statistics Canada; TorontoReal Estate Board; Maclean's in the x-axis and Number of people for populationDollars for house prices in the y-axis.. The x-axis shows values from -0.5 to 8.5. The y-axis shows values from -109017.21992277777 to 529268.2747327777.