Edit chart
Loading graph
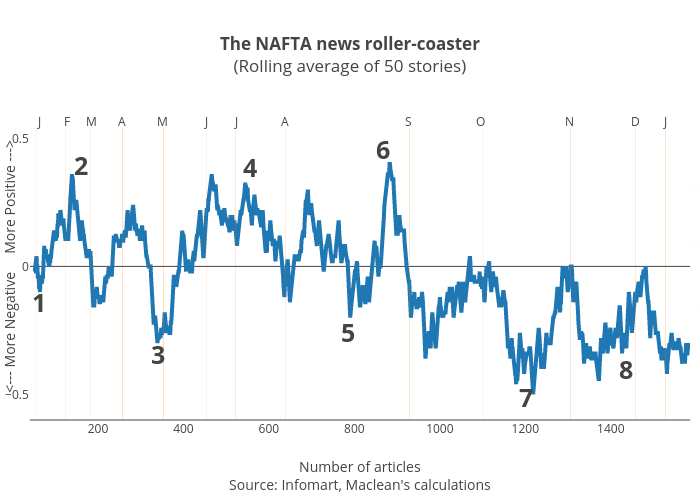
Jasonkirby's interactive graph and data of "The NAFTA news roller-coaster(Rolling average of 50 stories)" is a line chart, showing B vs C; with Number of articlesSource: Infomart, Maclean's calculations in the x-axis and in the y-axis.. The x-axis shows values from 49.444716471647155 to 1585. The y-axis shows values from -0.6 to 0.6. This visualization has the following annotations: 1; 2; 3; 4; 5; 6; 7; 8; J; F; M; A; M; J; J; A; S; O; N; D; J