Edit chart
Loading graph
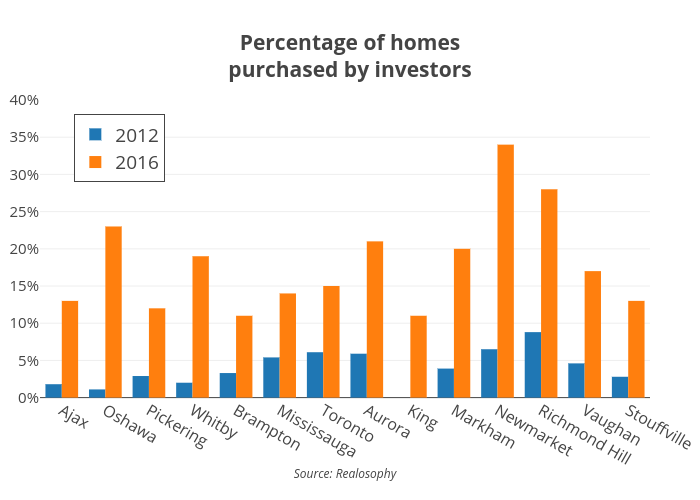
Jasonkirby's interactive graph and data of "Percentage of homespurchased by investors" is a bar chart, showing 2012 vs 2016; with Source: Realosophy in the x-axis. The x-axis shows values from -0.5 to 13.5. The y-axis shows values from 0 to 40.