Edit chart
Loading graph
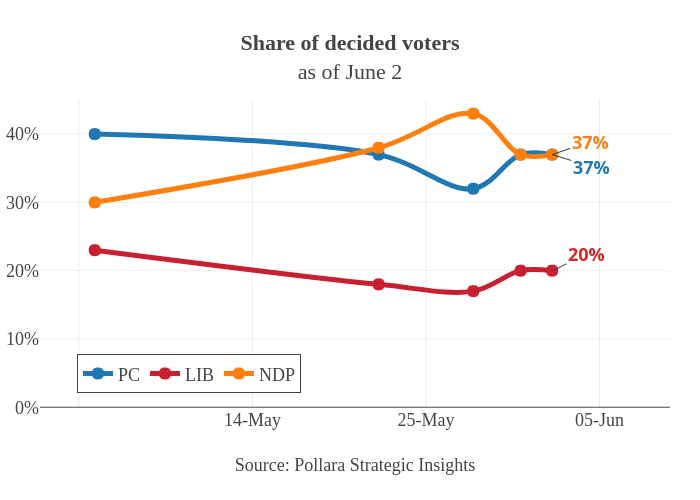
Jasonkirby's interactive graph and data of "Share of decided votersas of June 2" is a line chart, showing PC, LIB, NDP; with Source: Pollara Strategic Insights in the x-axis. The x-axis shows values from -2.246376811594203 to 37.2463768115942. The y-axis shows values from 0 to 44.99602859412232. This visualization has the following annotations: 37%; 37%; 20%