Edit chart
Loading graph
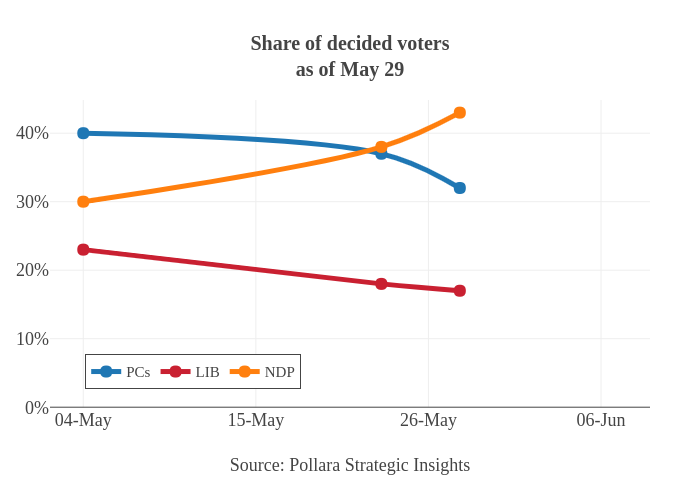
Jasonkirby's interactive graph and data of "Share of decided votersas of May 29" is a line chart, showing PCs, LIB, NDP; with Source: Pollara Strategic Insights in the x-axis. The x-axis shows values from -2.1222002635046113 to 36.12220026350461. The y-axis shows values from 0 to 44.84462963783856.