Edit chart
Loading graph
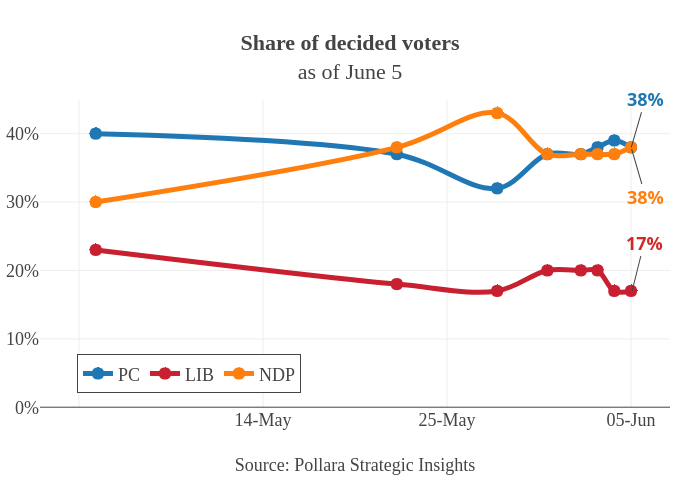
Jasonkirby's interactive graph and data of "Share of decided votersas of June 5" is a line chart, showing PC, LIB, NDP; with Source: Pollara Strategic Insights in the x-axis. The x-axis shows values from -2.053262955854126 to 35.05326295585412. The y-axis shows values from 0 to 44.92243341981257. This visualization has the following annotations: 38%; 38%; 17%