Edit chart
Loading graph
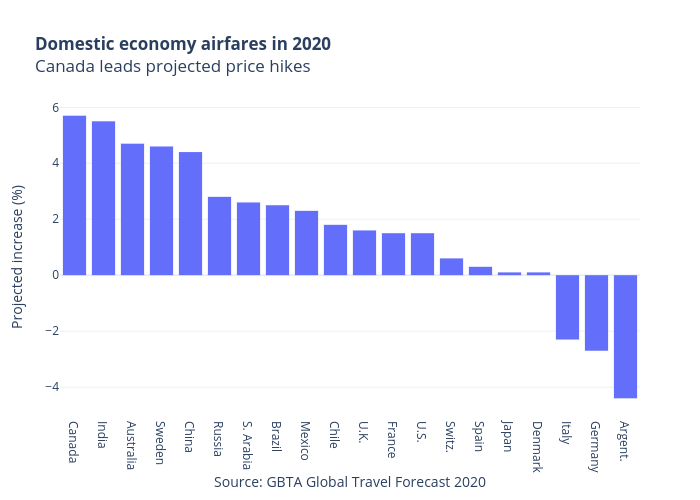
Jasonkirby's interactive graph and data of "Domestic economy airfares in 2020Canada leads projected price hikes" is a bar chart; with Source: GBTA Global Travel Forecast 2020 in the x-axis and Projected increase (%) in the y-axis.. The x-axis shows values from -0.5 to 19.5. The y-axis shows values from -4.961111111111111 to 6.261111111111111.