Edit chart
Loading graph
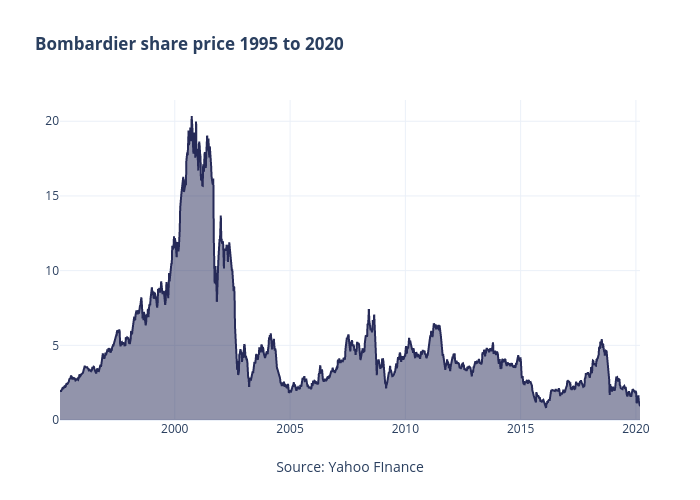
Jasonkirby's interactive graph and data of "Bombardier share price 1995 to 2020" is a line chart; with Source: Yahoo FInance in the x-axis. The x-axis shows values from 1995-01-09 to 2020-03-06. The y-axis shows values from 0 to 21.424674736842107.