Edit chart
Loading graph
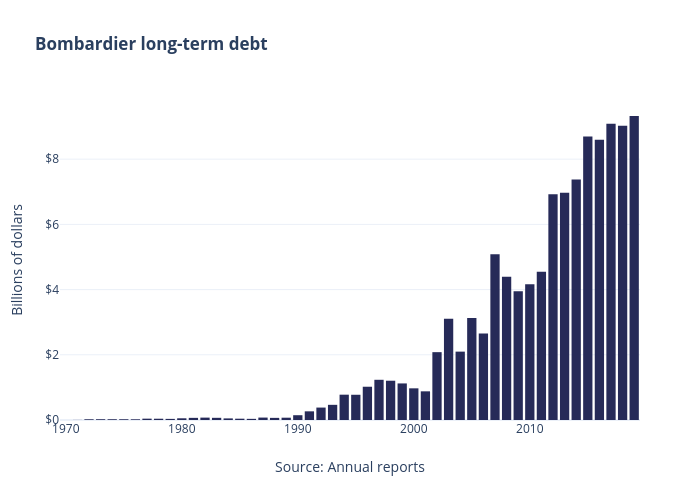
Jasonkirby's interactive graph and data of "Bombardier long-term debt" is a bar chart; with Source: Annual reports in the x-axis and Billions of dollars in the y-axis.. The x-axis shows values from 1969.5 to 2019.5. The y-axis shows values from 0 to 9.814736842105264.