Edit chart
Loading graph
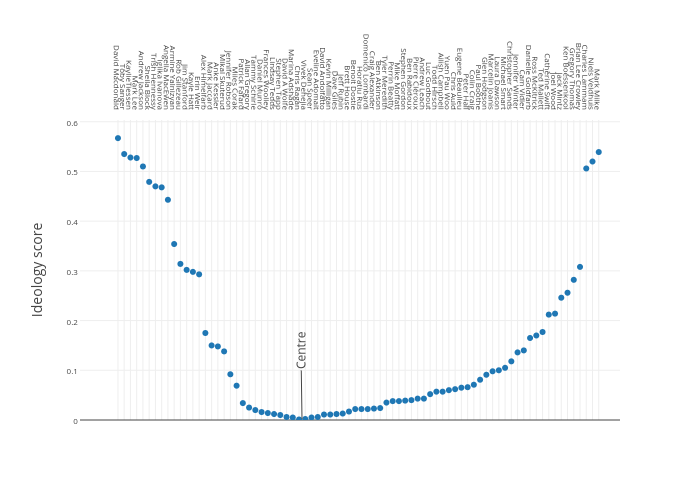
Jasonkirby's interactive graph and data of "Col1" is a scatter chart, showing Col1; with Ideology score in the y-axis. The x-axis shows values from -6.079533941236068 to 80.4047619047619. The y-axis shows values from 0 to 0.6035. This visualization has the following annotations: Canadian Economists' TwitterInferred Ideology; Centre