Edit chart
Loading graph
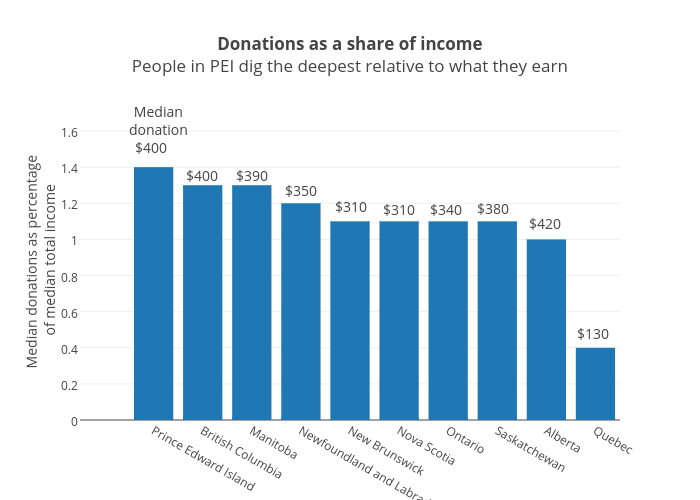
Jasonkirby's interactive graph and data of "Donations as a share of incomePeople in PEI dig the deepest relative to what they earn" is a bar chart, showing Col2; with Median donations as percentage of median total income in the y-axis. The x-axis shows values from 0.5 to 10.5. The y-axis shows values from 0 to 1.7680192058427553. This visualization has the following annotations: Mediandonation$400 ; $400; $390; $350; $310; $310; $340; $380; $420; $130