Edit chart
Loading graph
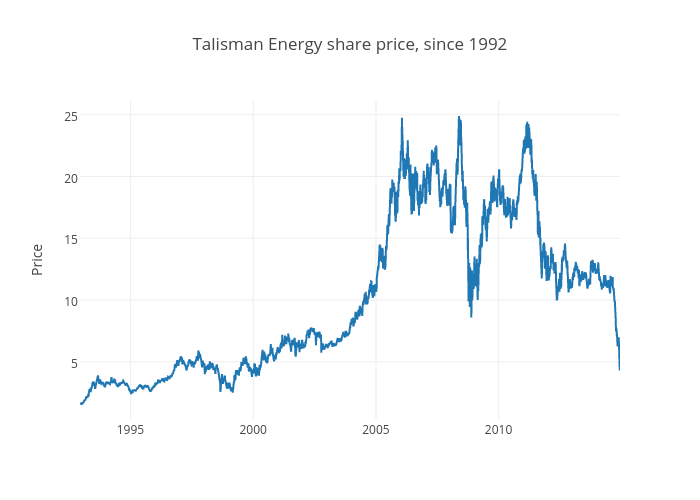
Jasonkirby's interactive graph and data of "Talisman Energy share price, since 1992" is a scatter chart, showing Col2; with time in the x-axis and Price in the y-axis.. The x-axis shows values from 723877200000 to 1418360400000. The y-axis shows values from 0.287927777777778 to 26.195372222222222.