Edit chart
Loading graph
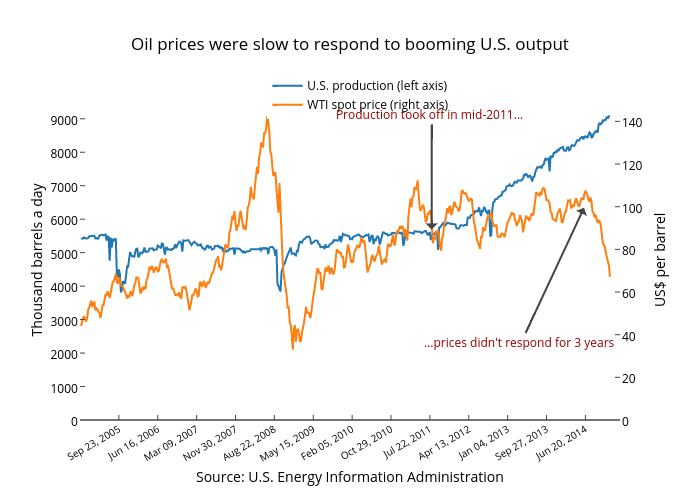
Jasonkirby's interactive graph and data of "Oil prices were slow to respond to booming U.S. output" is a scatter chart, showing U.S. production (left axis) vs WTI spot price (right axis); with Source: U.S. Energy Information Administration in the x-axis and Thousand barrels a day in the y-axis.. The x-axis shows values from 0 to 518. The y-axis shows values from 0 to 9561.052631578947. This visualization has the following annotations: Production took off in mid-2011... ; ...prices didn't respond for 3 years