Edit chart
Loading graph
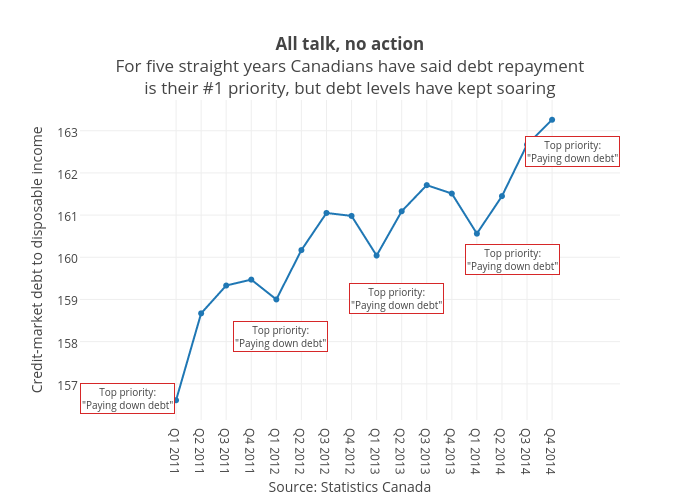
Jasonkirby's interactive graph and data of "All talk, no actionFor five straight years Canadians have said debt repaymentis their #1 priority, but debt levels have kept soaring" is a scatter chart, showing Credit-market debt to disposable income; with Source: Statistics Canada in the x-axis and Credit-market debt to disposable income in the y-axis.. The x-axis shows values from -3.1995065208757882 to 17.0762265510674. The y-axis shows values from 156.15275982256023 to 163.71724017743978. This visualization has the following annotations: Top priority:"Paying down debt"; Top priority:"Paying down debt"; Top priority:"Paying down debt"; Top priority:"Paying down debt"; Top priority:"Paying down debt"