Edit chart
Loading graph
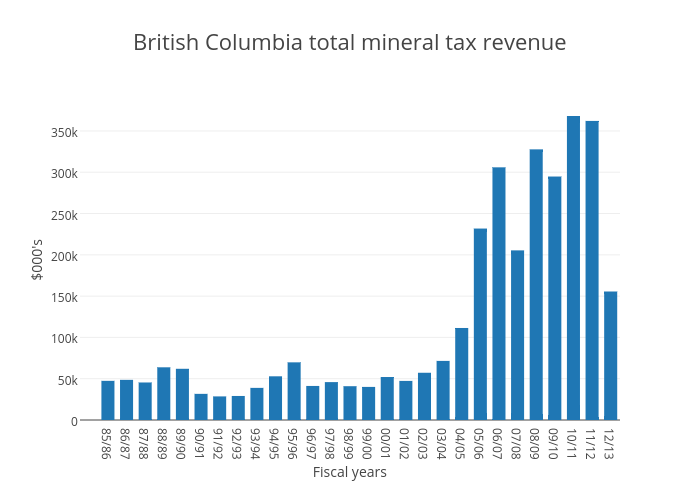
Jasonkirby's interactive graph and data of "British Columbia total mineral tax revenue" is a bar chart, showing Col2; with Fiscal years in the x-axis and $000's in the y-axis.. The x-axis shows values from 0.5 to 28.5. The y-axis shows values from 0 to 387452.63157894736.