Edit chart
Loading graph
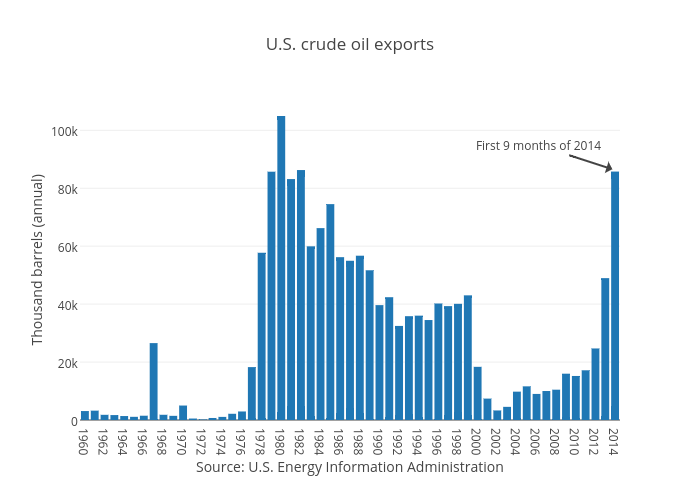
Jasonkirby's interactive graph and data of "U.S. crude oil exports" is a bar chart, showing x; with Source: U.S. Energy Information Administration in the x-axis and Thousand barrels (annual) in the y-axis.. The x-axis shows values from 1959.5 to 2014.5. The y-axis shows values from 0 to 110457.8947368421. This visualization has the following annotation: First 9 months of 2014