Edit chart
Loading graph
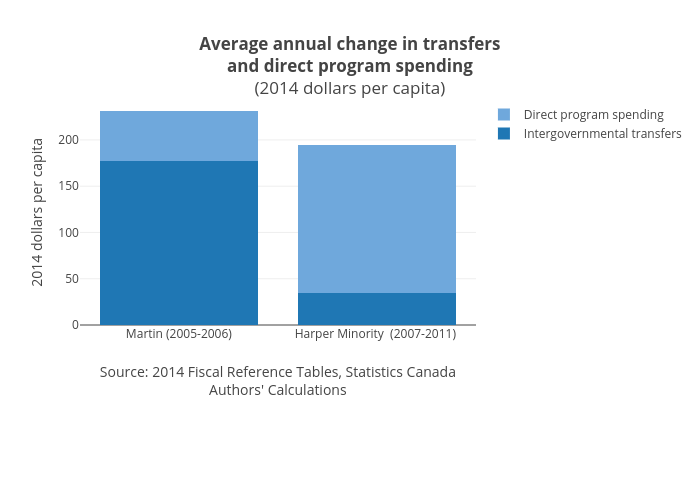
Jasonkirby's interactive graph and data of "Average annual change in transfersand direct program spending(2014 dollars per capita)" is a stacked bar chart, showing Intergovernmental transfers vs Direct program spending; with Source: 2014 Fiscal Reference Tables, Statistics CanadaAuthors' Calculations in the x-axis and 2014 dollars per capita in the y-axis.. The x-axis shows values from -0.5 to 1.5. The y-axis shows values from 0 to 243.1578947368421.