Edit chart
Loading graph
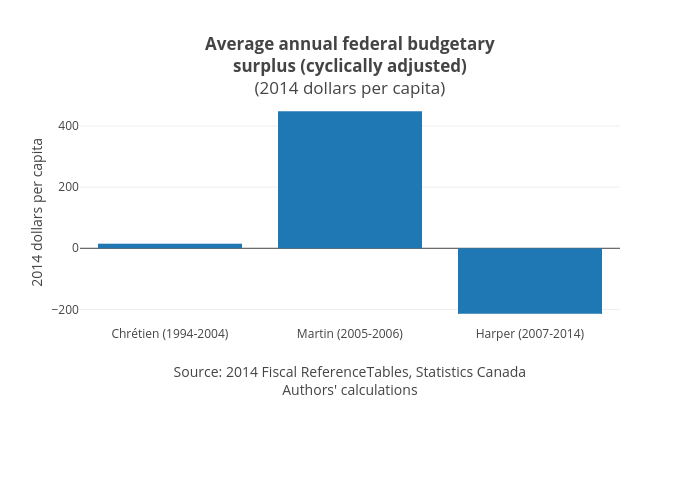
Jasonkirby's interactive graph and data of "Average annual federal budgetarysurplus (cyclically adjusted)(2014 dollars per capita)" is a bar chart, showing Col2; with Source: 2014 Fiscal ReferenceTables, Statistics CanadaAuthors' calculations in the x-axis and 2014 dollars per capita in the y-axis.. The x-axis shows values from -0.5 to 2.5. The y-axis shows values from -250.77777777777777 to 484.77777777777777.