Edit chart
Loading graph
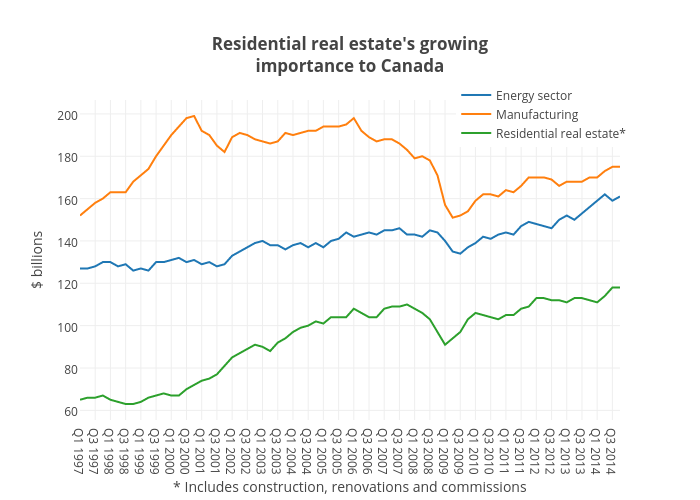
Jasonkirby's interactive graph and data of "Residential real estate's growingimportance to Canada" is a scatter chart, showing Energy sector, Manufacturing, Residential real estate*; with * Includes construction, renovations and commissions in the x-axis and $ billions in the y-axis.. The x-axis shows values from 0 to 71. The y-axis shows values from 55.44444444444444 to 206.55555555555554.