Edit chart
Loading graph
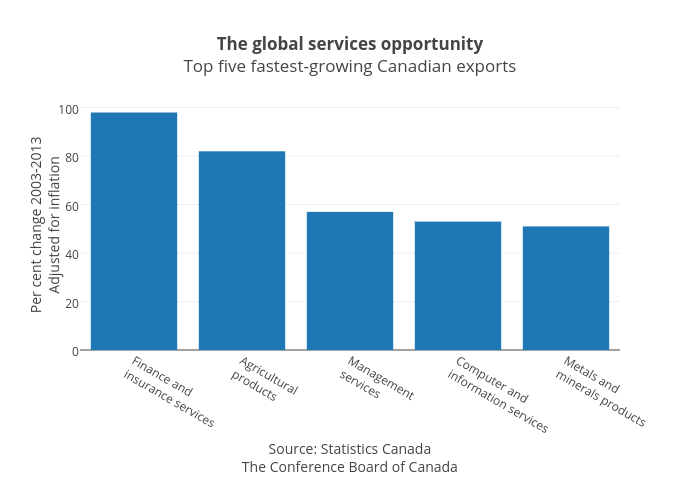
Jasonkirby's interactive graph and data of "The global services opportunityTop five fastest-growing Canadian exports" is a bar chart, showing Per cent change 2003-2013; with Source: Statistics CanadaThe Conference Board of Canada in the x-axis and Per cent change 2003-2013Adjusted for inflation in the y-axis.. The x-axis shows values from -0.5 to 4.5. The y-axis shows values from 0 to 103.15789473684211.