Edit chart
Loading graph
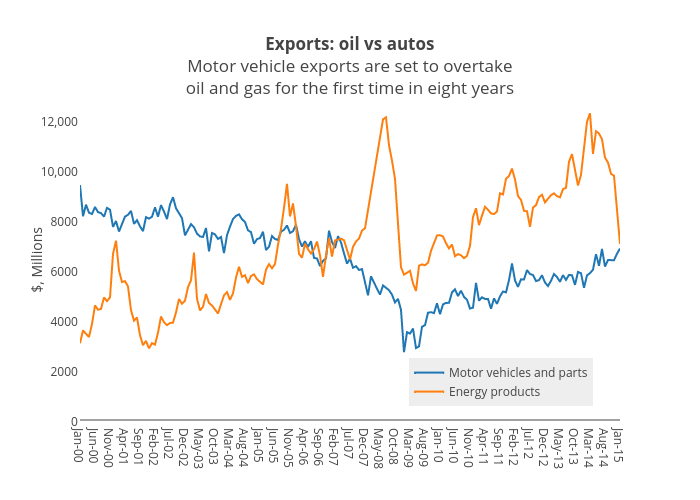
Jasonkirby's interactive graph and data of "Exports: oil vs autosMotor vehicle exports are set to overtakeoil and gas for the first time in eight years" is a scatter chart, showing Motor vehicles and parts vs Energy products; with $, Millions in the y-axis. The x-axis shows values from 0 to 180. The y-axis shows values from 0 to 12796.733333333334.