Edit chart
Loading graph
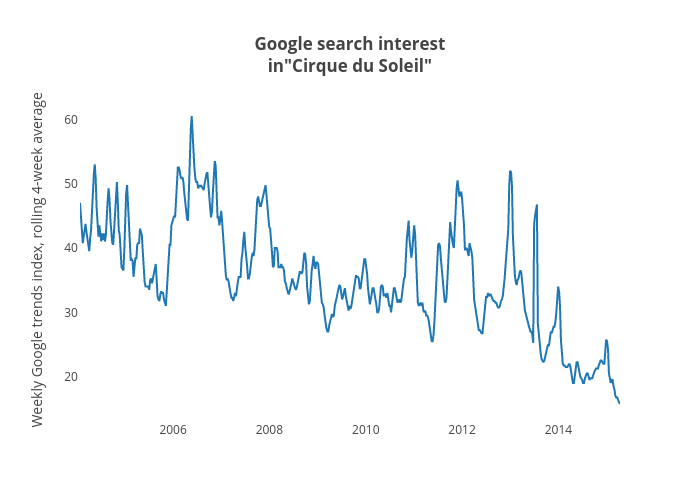
Jasonkirby's interactive graph and data of "Google search interestin"Cirque du Soleil"" is a scatter chart, showing Interest over time in"Cirque du Soleil"; with time in the x-axis and Weekly Google trends index, rolling 4-week average in the y-axis.. The x-axis shows values from 1075006800000 to 1428811200000. The y-axis shows values from 13.01388888888889 to 62.736111111111114.