Edit chart
Loading graph
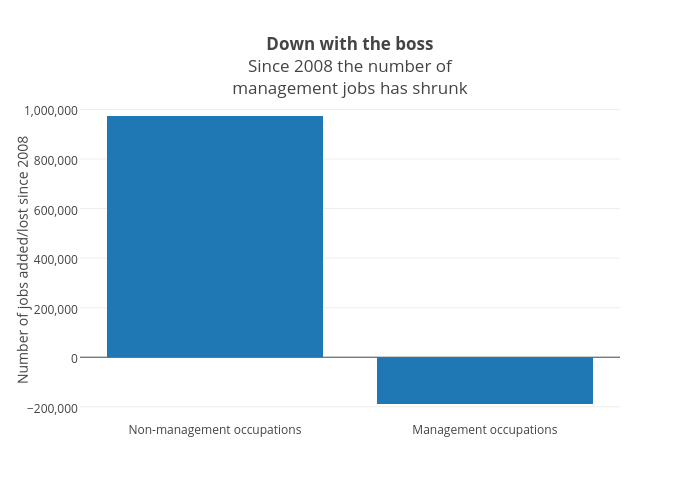
Jasonkirby's interactive graph and data of "Down with the bossSince 2008 the number ofmanagement jobs has shrunk" is a bar chart, showing Col2; with Number of jobs added/lost since 2008 in the y-axis. The x-axis shows values from -0.5 to 1.5. The y-axis shows values from -253377.77777777778 to 1038177.7777777778.