Edit chart
Loading graph
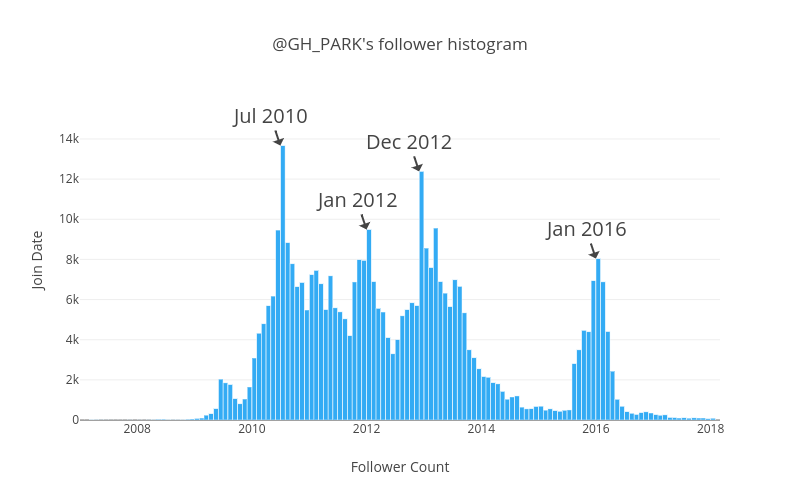
Jcheong0428's interactive graph and data of "@GH_PARK's follower histogram" is a histogram; with Follower Count in the x-axis and Join Date in the y-axis.. The x-axis shows values from 0 to 0. The y-axis shows values from 0 to 0. This visualization has the following annotations: Jul 2010; Jan 2012; Dec 2012; Jan 2016