Edit chart
Loading graph
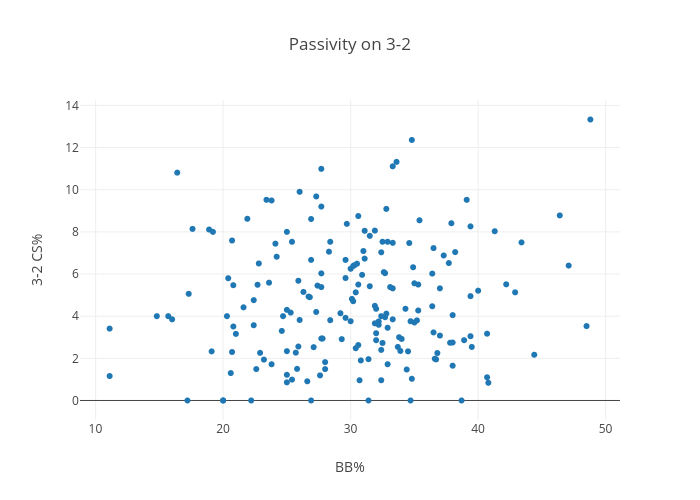
Jclarkin316's interactive graph and data of "Passivity on 3-2" is a scatter chart, showing 3-2 CS%; with BB% in the x-axis and 3-2 CS% in the y-axis.. The x-axis shows values from 8.7758007898201 to 51.124199210179896. The y-axis shows values from -0.9260654642618569 to 14.256065464261855.