Edit chart
Loading graph
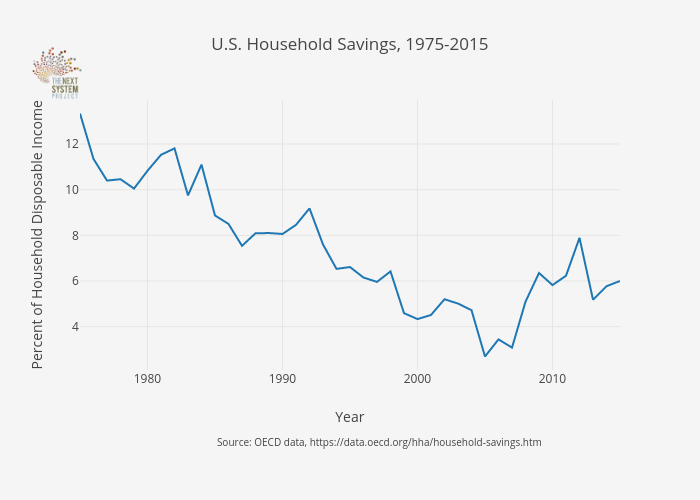
Jduda's interactive graph and data of "U.S. Household Savings, 1975-2015" is a line chart, showing B; with Year in the x-axis and Percent of Household Disposable Income in the y-axis.. The x-axis shows values from 1975 to 2015. The y-axis shows values from 2.098333333333333 to 13.931666666666667. This visualization has the following annotation: Source: OECD data, https://data.oecd.org/hha/household-savings.htm