Edit chart
Loading graph
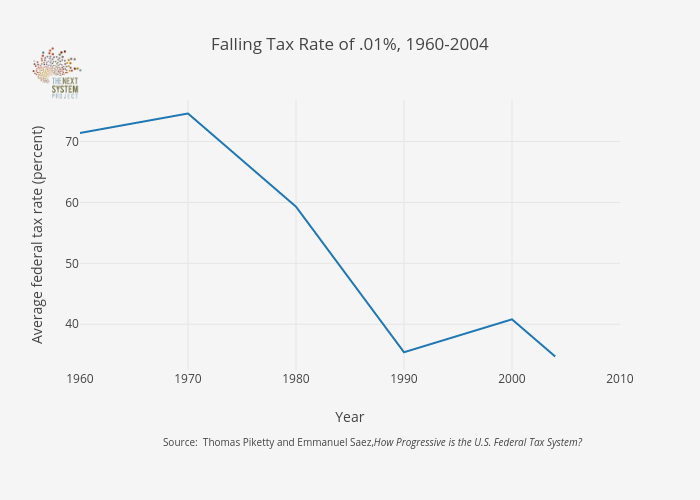
Jduda's interactive graph and data of "Falling Tax Rate of .01%, 1960-2004" is a line chart, showing B; with Year in the x-axis and Average federal tax rate (percent) in the y-axis.. The x-axis shows values from 1960 to 2010. The y-axis shows values from 32.483333333333334 to 76.81666666666666. This visualization has the following annotation: Source: Thomas Piketty and Emmanuel Saez,How Progressive is the U.S. Federal Tax System?