Edit chart
Loading graph
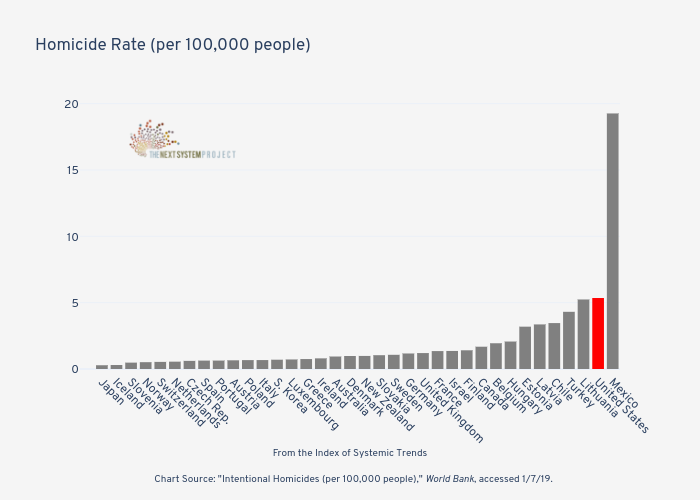
Jduda's interactive graph and data of "Homicide Rate (per 100,000 people)" is a bar chart, showing ; with From the Index of Systemic Trends Chart Source: "Intentional Homicides (per 100,000 people)," World Bank, accessed 1/7/19. in the x-axis and in the y-axis.. The x-axis shows values from -0.5 to 36.5. The y-axis shows values from 0 to 20.273684210526316.