Edit chart
Loading graph
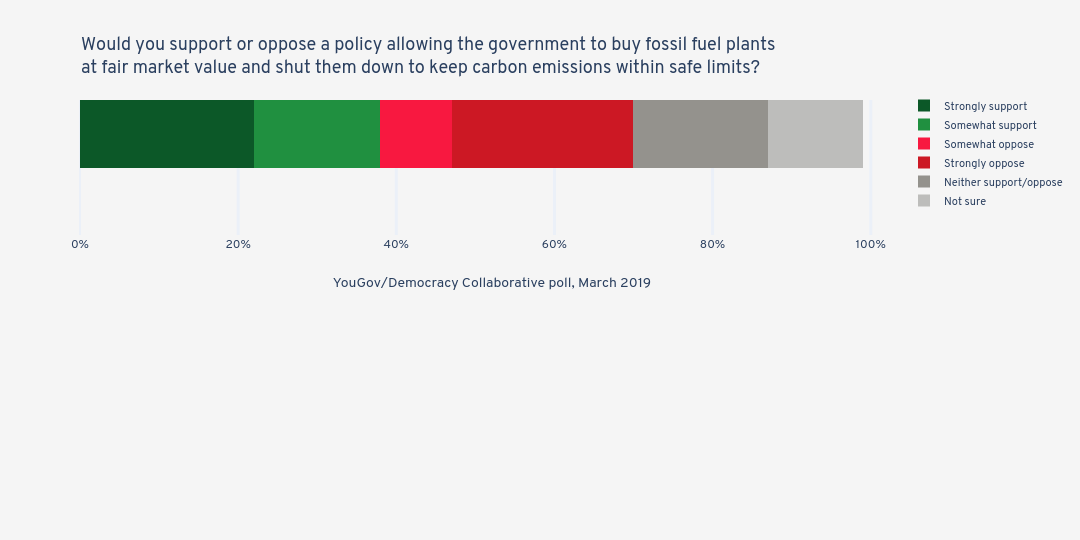
Jduda's interactive graph and data of "Would you support or oppose a policy allowing the government to buy fossil fuel plants at fair market value and shut them down to keep carbon emissions within safe limits?" is a stacked bar chart, showing Strongly support, Somewhat support, Somewhat oppose, Strongly oppose, Neither support/oppose, Not sure; with YouGov/Democracy Collaborative poll, March 2019 in the x-axis. The x-axis shows values from 0 to 104.21052631578948. The y-axis shows values from -0.5 to 1.5.