Edit chart
Loading graph
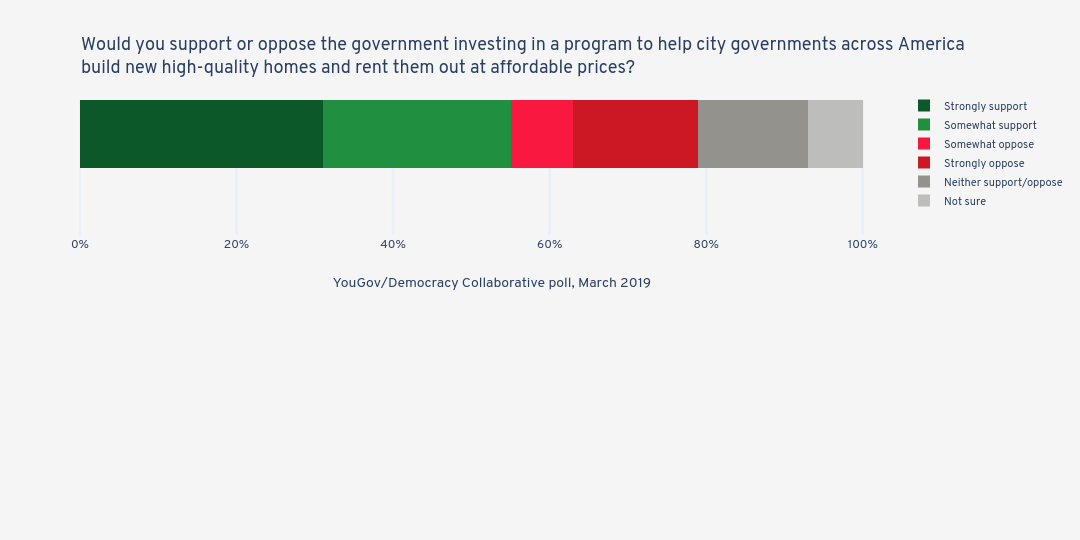
Jduda's interactive graph and data of "Would you support or oppose the government investing in a program to help city governments across America build new high-quality homes and rent them out at affordable prices?" is a stacked bar chart, showing Strongly support, Somewhat support, Somewhat oppose, Strongly oppose, Neither support/oppose, Not sure; with YouGov/Democracy Collaborative poll, March 2019 in the x-axis. The x-axis shows values from 0 to 105.26315789473685. The y-axis shows values from -0.5 to 1.5.