Edit chart
Loading graph
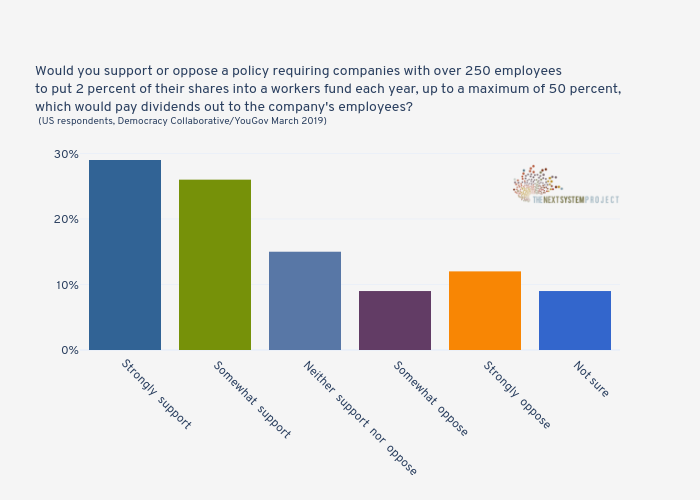
Jduda's interactive graph and data of "Would you support or oppose a policy requiring companies with over 250 employeesto put 2 percent of their shares into a workers fund each year, up to a maximum of 50 percent, which would pay dividends out to the company's employees? (US respondents, Democracy Collaborative/YouGov March 2019)" is a bar chart, showing ; with in the y-axis. The x-axis shows values from -0.5 to 5.5. The y-axis shows values from 0 to 30.526315789473685.