Edit chart
Loading graph
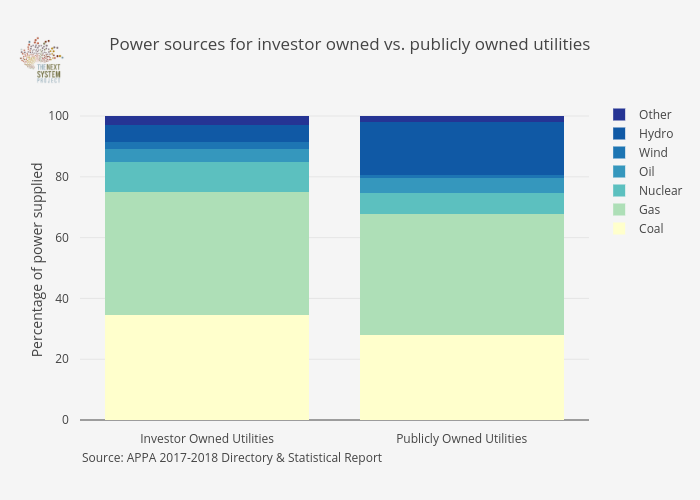
Jduda's interactive graph and data of "Power sources for investor owned vs. publicly owned utilities" is a stacked bar chart, showing Coal, Gas, Nuclear, Oil, Wind, Hydro, Other; with Percentage of power supplied in the y-axis. The x-axis shows values from -0.5 to 1.5. The y-axis shows values from 0 to 105.26315789473686. This visualization has the following annotation: Source: APPA 2017-2018 Directory & Statistical Report