Edit chart
Loading graph
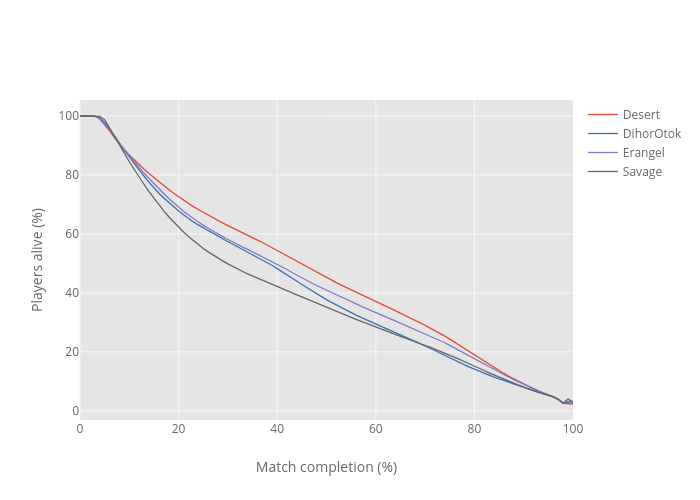
Jeanmidev's interactive graph and data of "{'font': {'color': '#151516'}}" is a line chart, showing Desert, DihorOtok, Erangel, Savage; with Match completion (%) in the x-axis and Players alive (%) in the y-axis.. The x-axis shows values from 0 to 0. The y-axis shows values from 0 to 0.