Edit chart
Loading graph
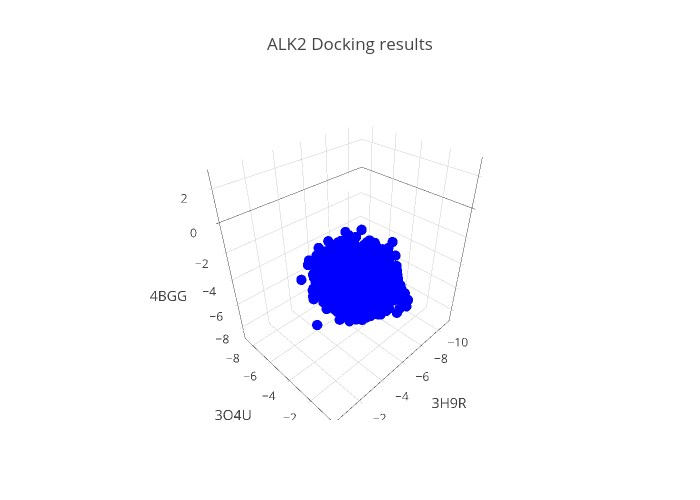
Jeiros's interactive graph and data of "ALK2 Docking results" is a scatter3d. The x-axis shows values from 0 to 0. The y-axis shows values from 0 to 0.