Edit chart
Loading graph
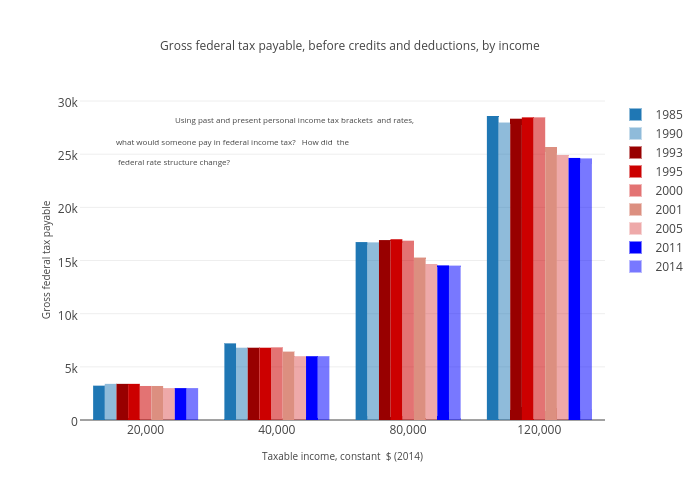
Jenniferrobson's interactive graph and data of "Gross federal tax payable, before credits and deductions, by income" is a bar chart, showing 1985, 1990, 1993, 1995, 2000, 2001, 2005, 2011, 2014; with Taxable income, constant $ (2014) in the x-axis and Gross federal tax payable in the y-axis.. The x-axis shows values from -0.5 to 3.5. The y-axis shows values from 0 to 30101.052631578947. This visualization has the following annotations: Using past and present personal income tax brackets and rates, ; what would someone pay in federal income tax? How did the ; federal rate structure change?