Edit chart
Loading graph
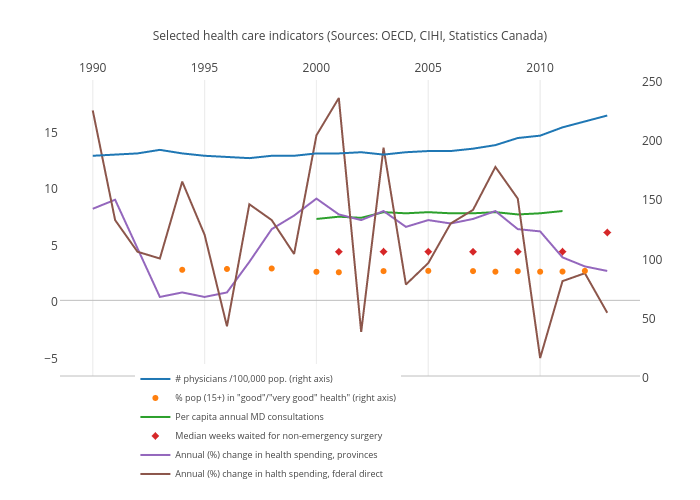
Jenniferrobson's interactive graph and data of "Selected health care indicators (Sources: OECD, CIHI, Statistics Canada)" is a scatter chart, showing # physicians /100,000 pop. (right axis), % pop (15+) in "good"/"very good" health" (right axis), Per capita annual MD consultations, Median weeks waited for non-emergency surgery, Annual (%) change in health spending, provinces, Annual (%) change in halth spending, fderal direct. The x-axis shows values from 1988.4616639477977 to 2014.5383360522023. The y-axis shows values from -6.377777777777777 to 19.177777777777777.