Edit chart
Loading graph
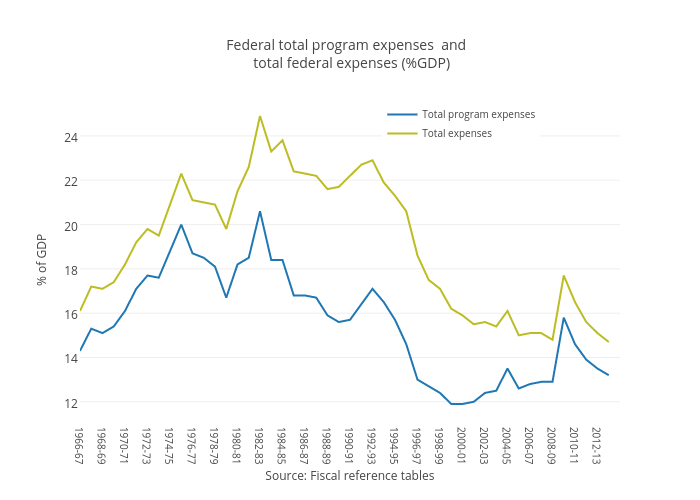
Jenniferrobson's interactive graph and data of "Federal total program expenses and total federal expenses (%GDP)" is a scatter chart, showing Total program expenses vs Total expenses; with Source: Fiscal reference tables in the x-axis and % of GDP in the y-axis.. The x-axis shows values from 0 to 48. The y-axis shows values from 11.177777777777779 to 25.62222222222222.