Edit chart
Loading graph
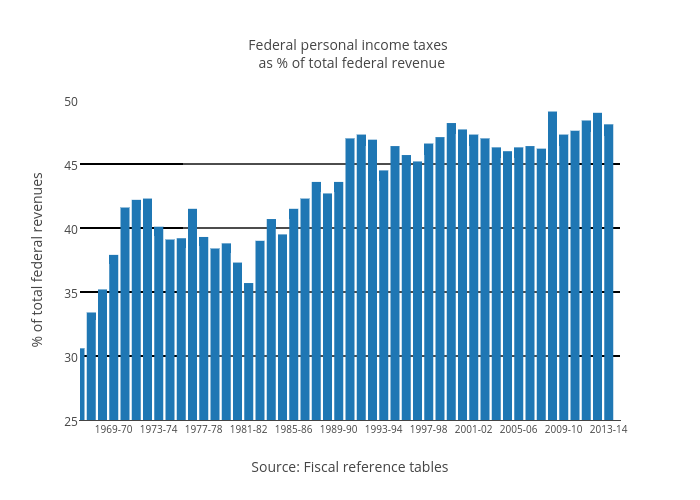
Jenniferrobson's interactive graph and data of "Federal personal income taxes as % of total federal revenue" is a bar chart, showing Col2; with Source: Fiscal reference tables in the x-axis and % of total federal revenues in the y-axis.. The x-axis shows values from 0 to 48. The y-axis shows values from 25 to 50.