Edit chart
Loading graph
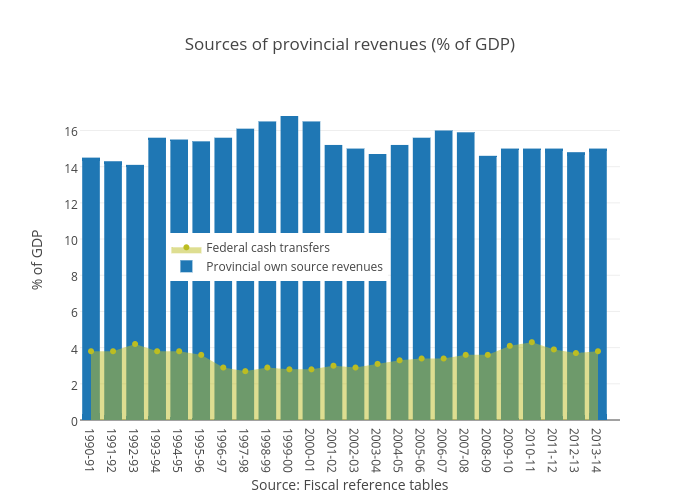
Jenniferrobson's interactive graph and data of "Sources of provincial revenues (% of GDP) " is a filled bar chart, showing Provincial own source revenues vs Federal cash transfers; with Source: Fiscal reference tables in the x-axis and % of GDP in the y-axis.. The x-axis shows values from -0.5 to 24. The y-axis shows values from 0 to 17.68421052631579.