Edit chart
Loading graph
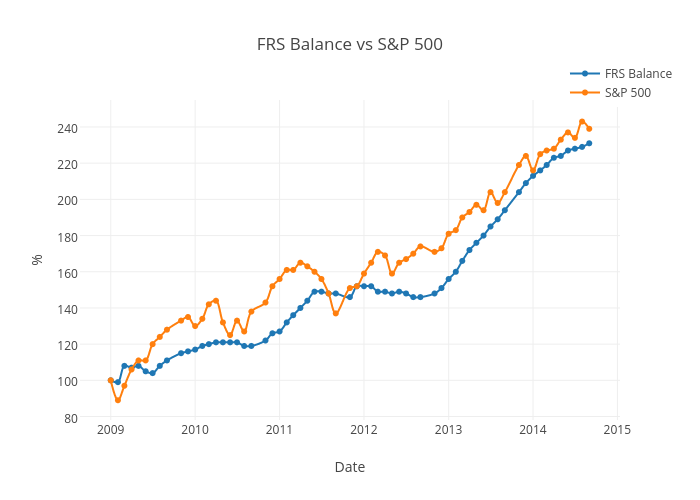
Jevgen's interactive graph and data of "FRS Balance vs S&P 500" is a line chart, showing FRS Balance vs S&P 500; with Date in the x-axis and % in the y-axis.. The x-axis shows values from 1219439188826.8157 to 1420833211173.1843. The y-axis shows values from 78.78233830845771 to 254.21766169154228.