Edit chart
Loading graph
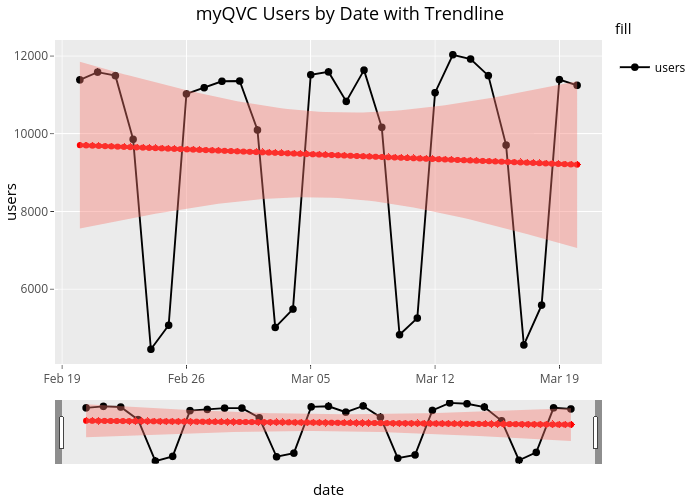
Jf634462's interactive graph and data of "myQVC Users by Date with Trendline" is a , showing users, users, users; with date in the x-axis and users in the y-axis.. The x-axis shows values from 1518963840000 to 1521624960000. The y-axis shows values from 4073.95 to 12413.05. This visualization has the following annotation: fill