Edit chart
Loading graph
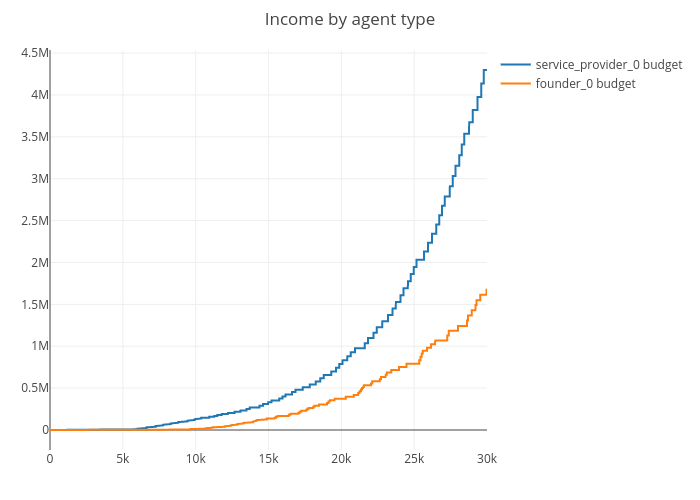
Jg2950's interactive graph and data of "Income by agent type" is a line chart, showing service_provider_0 budget vs founder_0 budget. The x-axis shows values from 0 to 29998. The y-axis shows values from -238762.05875661652 to 4536479.116375715.