Edit chart
Loading graph
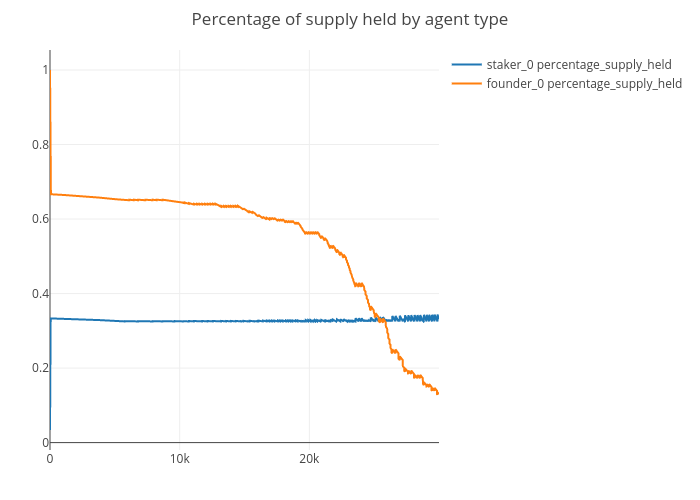
Jg2950's interactive graph and data of "Percentage of supply held by agent type" is a line chart, showing staker_0 percentage_supply_held vs founder_0 percentage_supply_held. The x-axis shows values from 0 to 29995. The y-axis shows values from -0.01986054361409794 to 1.0536768707165314.