Edit chart
Loading graph
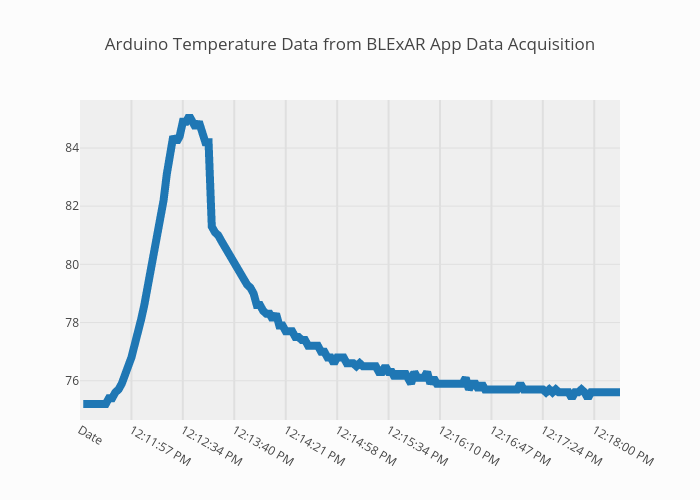
Jhrisko000's interactive graph and data of "Arduino Temperature Data from BLExAR App Data Acquisition" is a line chart. The x-axis shows values from 0 to 168. The y-axis shows values from 74.65 to 85.64999999999999.