Edit chart
Loading graph
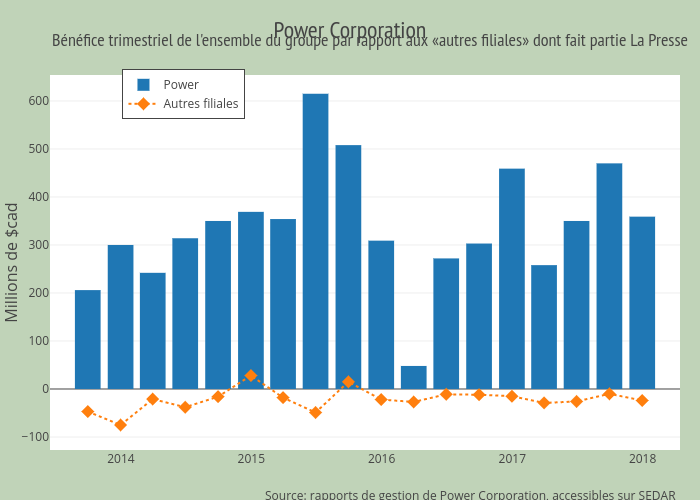
Jhroy's interactive graph and data of "Power Corporation" is a bar chart, showing Power vs Autres filiales; with time in the x-axis and Millions de $cad in the y-axis.. The x-axis shows values from 2013-06-21 18:34:38.4273 to 2018-04-10 05:25:21.5727. The y-axis shows values from -129.08721232047066 to 654.1624848589721. This visualization has the following annotations: Source: rapports de gestion de Power Corporation, accessibles sur SEDAR; Bénéfice trimestriel de l'ensemble du groupe par rapport aux «autres filiales» dont fait partie La Presse