decrease
increase
0
2
4
6
8
10
decrease
increase
decrease
increase
CNN Points v.s Gold
CNN Points v.s S&P 500
CNN Points v.s Nasdaq
Multiple Bar Charts with stock datasets
plotly-logomark
Edit chart
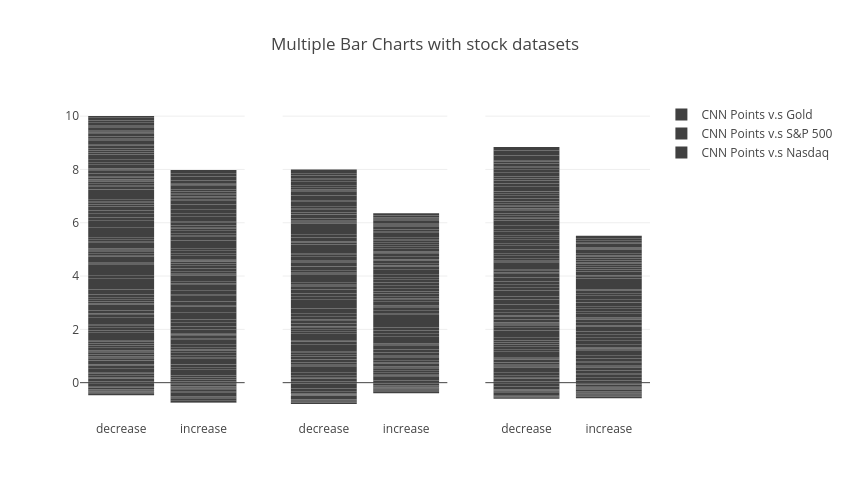
Jiajialiu113's interactive graph and data of "Multiple Bar Charts with stock datasets" is a bar chart, showing CNN Points v.s Gold, CNN Points v.s S&P 500, CNN Points v.s Nasdaq. The x-axis shows values from 0 to 0. The y-axis shows values from 0 to 0.