Edit chart
Loading graph
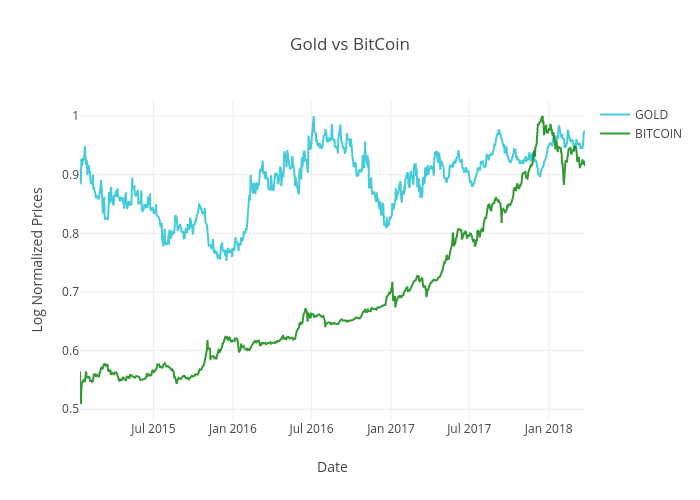
Jigull's interactive graph and data of "Gold vs BitCoin" is a scatter chart, showing GOLD vs BITCOIN; with Date in the x-axis and Log Normalized Prices in the y-axis.. The x-axis shows values from 2015-01-12 to 2018-03-26. The y-axis shows values from 0.48173783453260655 to 1.0272769560772312.