Edit chart
Loading graph
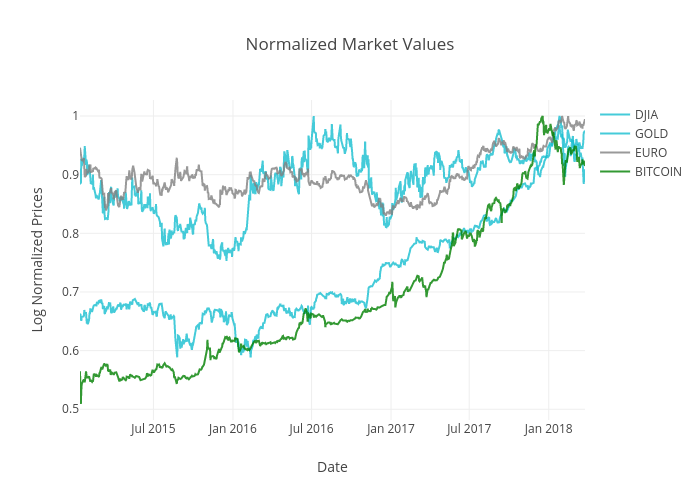
Jigull's interactive graph and data of "Normalized Market Values" is a scatter chart, showing DJIA, GOLD, EURO, BITCOIN; with Date in the x-axis and Log Normalized Prices in the y-axis.. The x-axis shows values from 2015-01-12 to 2018-03-26. The y-axis shows values from 0 to 0.