Edit chart
Loading graph
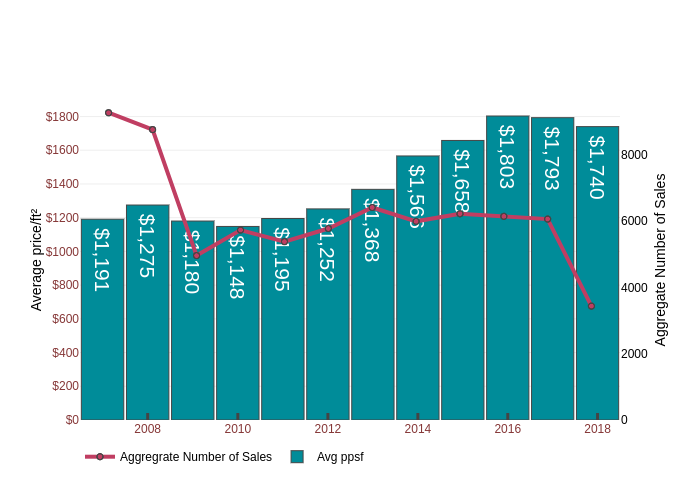
Jjaramillo34's interactive graph and data of "" is a overlaid bar chart, showing Avg ppsf vs Aggregrate Number of Sales; with in the x-axis and Average price/ft² in the y-axis.. The x-axis shows values from 3.302439164069857 to 3.305028753746333. The y-axis shows values from 0 to 1897.8947368421052.