Edit chart
Loading graph
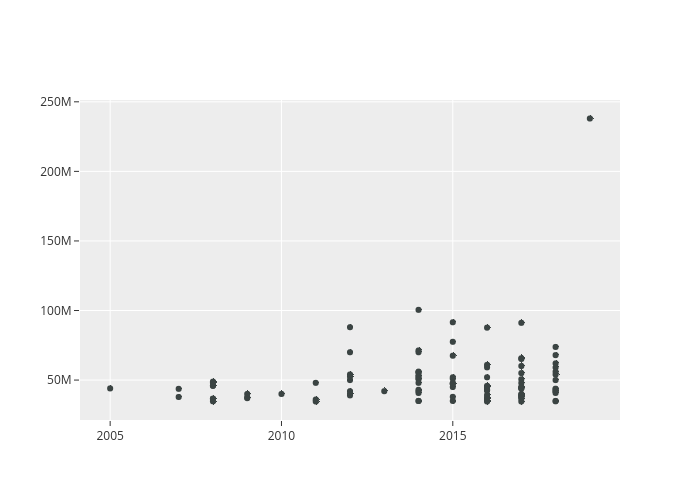
Jjaramillo34's interactive graph and data is a scatter chart. The x-axis shows values from 2004.1200980392157 to 2019.8799019607843. The y-axis shows values from 21301422.568460815 to 251300577.43153918.